
Visualcoders ✓
How we estimate
Known for
 2K views
O(1) Time Complexity Explained (DSA) #dsa #coding #codinginterview #computerscience #code #shorts
2K views
O(1) Time Complexity Explained (DSA) #dsa #coding #codinginterview #computerscience #code #shorts
 2K views
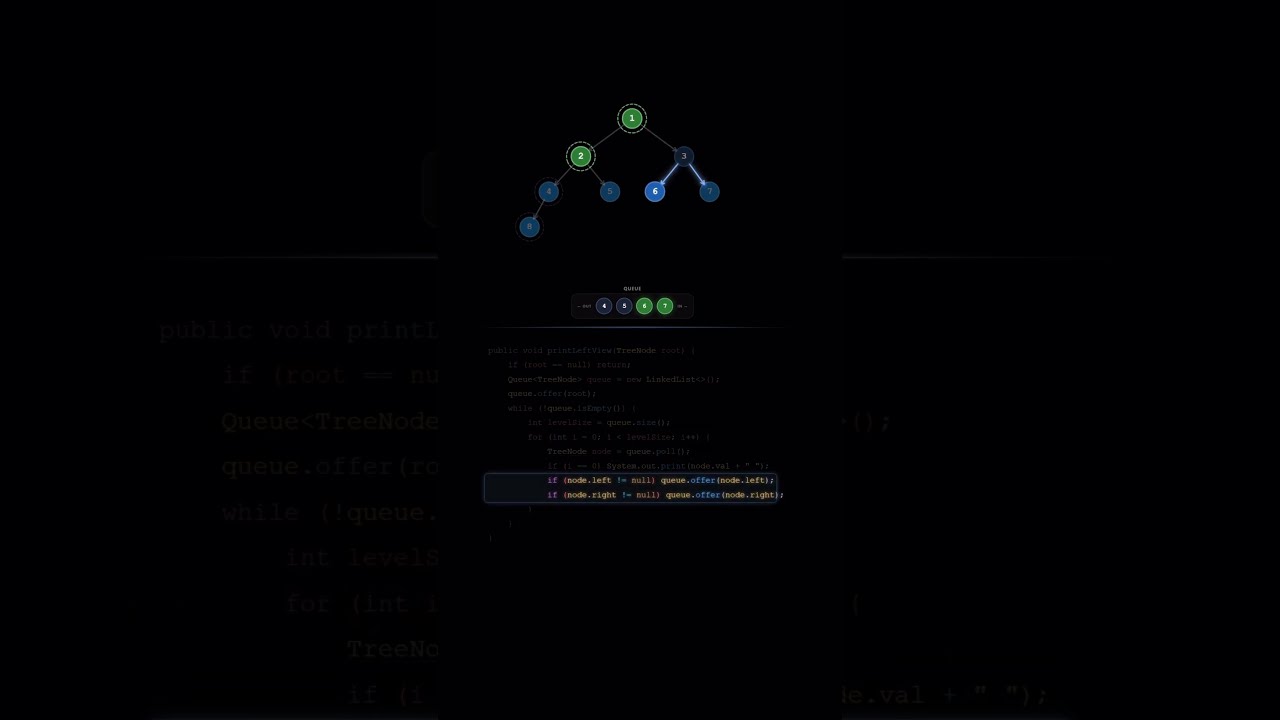
Left view of Binary Tree #dsa #shorts #coding #binarytree #programming
2K views
Left view of Binary Tree #dsa #shorts #coding #binarytree #programming
 1.4K views
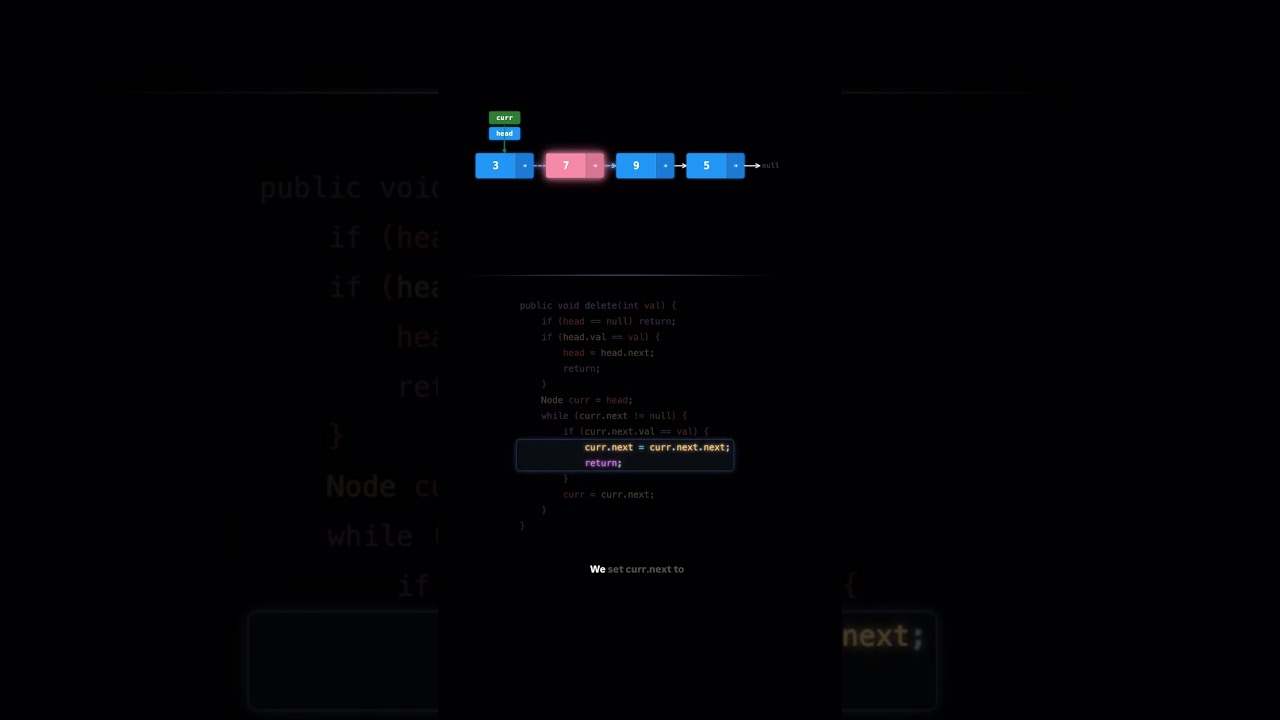
Delete mid node in linked list #linkedlist #visualization #dsa #shorts #codinginterview #cse
1.4K views
Delete mid node in linked list #linkedlist #visualization #dsa #shorts #codinginterview #cse
 1.3K views
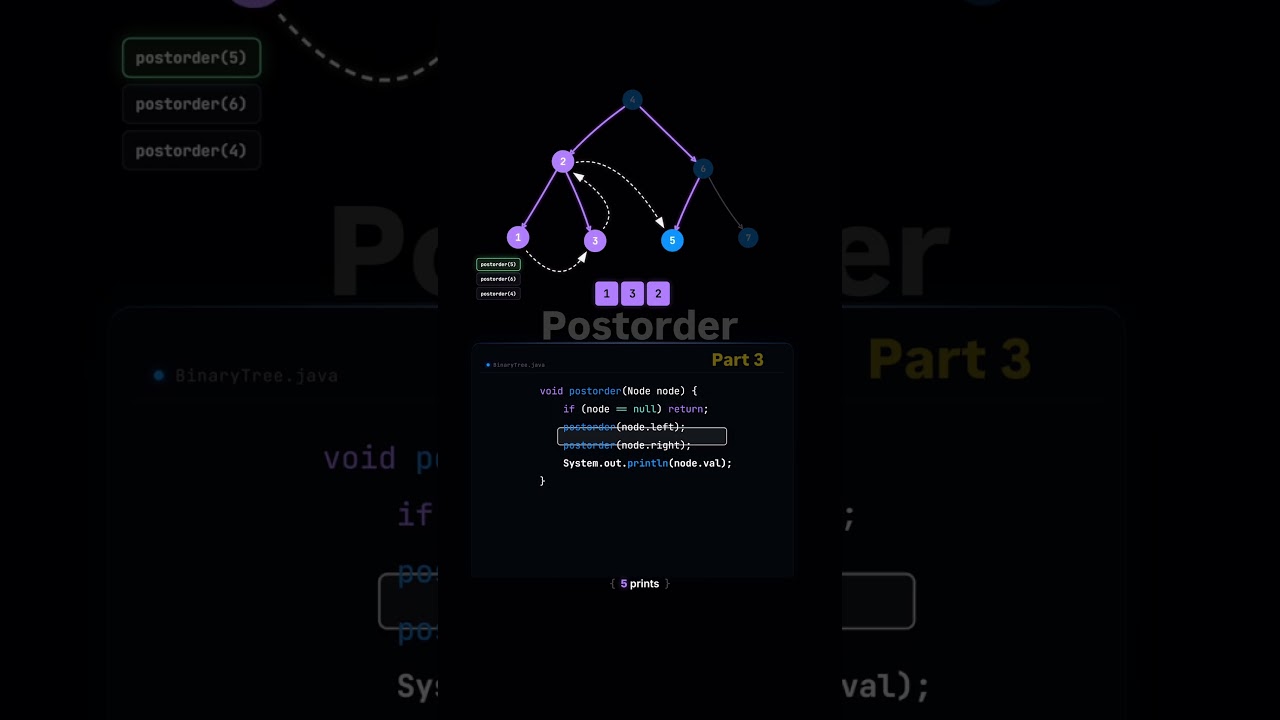
Understand Binary Tree Terminologies ( Introduction of Tree data structure) #dsa #coding #shorts
1.3K views
Understand Binary Tree Terminologies ( Introduction of Tree data structure) #dsa #coding #shorts
▶️ Featured Video
2K views📈 Performance
💡 Did you know?
🛡️ Audience credibility
- Est. 73% real, active audience · Medium fake-follower risk.
- Healthy view-through — roughly 26% of subscribers watch each video.
- 2.02% engagement — below the ~5% typical for this size.
Heuristic estimate from view-through, engagement vs size and recent growth — a screening signal, not a guarantee.
👥 Audience demographics
EstimatedModeled from this creator's niche, platform & region — a planning estimate, not connected analytics.
- India58%
- United States12%
- United Kingdom5%
- Pakistan4%
- United Arab Emirates3%
💚 Brand affinity
EstimatedBrands Visualcoders's audience is most likely to respond to — from detected sponsorships in this niche.
About
What you'll find here:
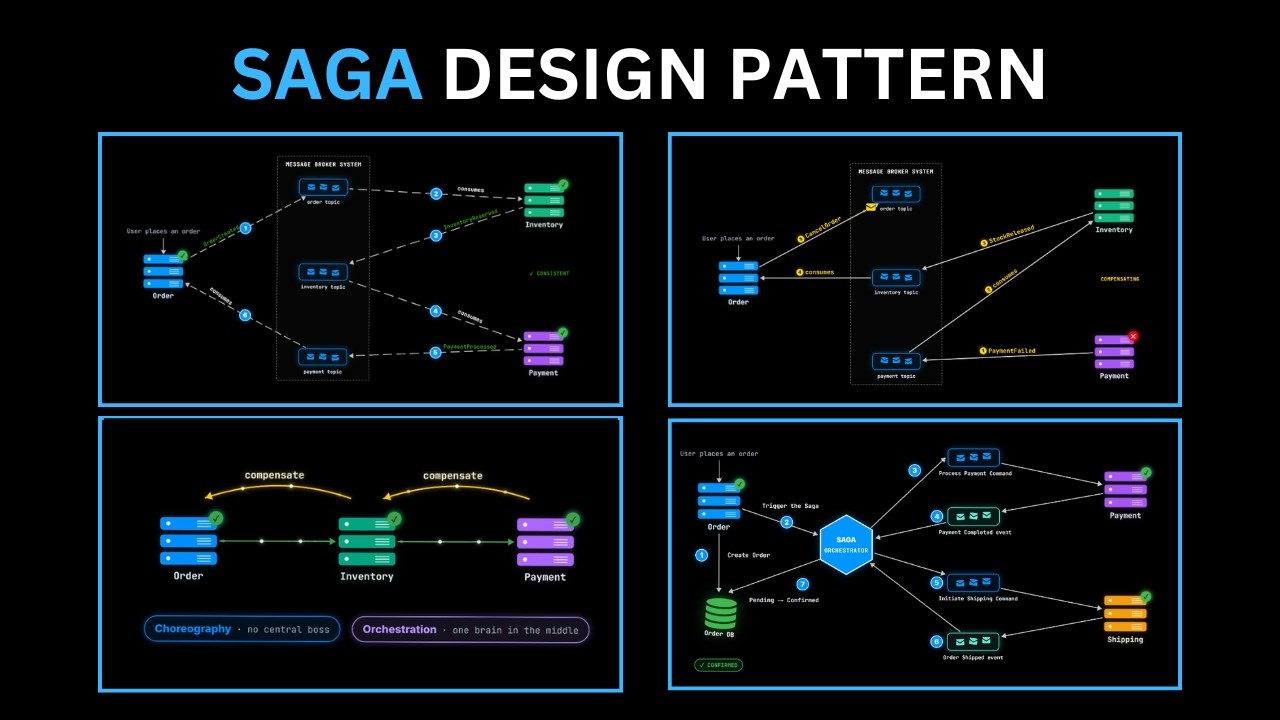
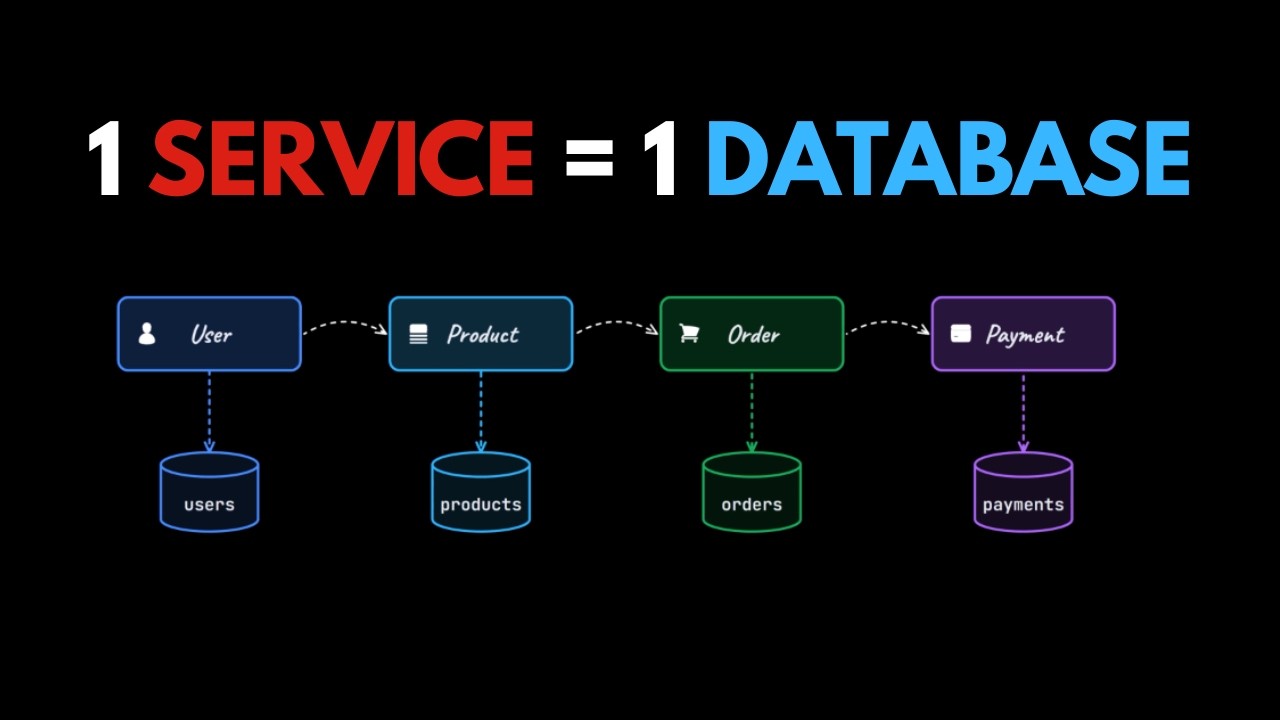
Quick visual breakdowns of core DSA topics — trees, graphs, linked lists, sorting, time complexity, and more
Interview-focused concepts explained in under a minute
A growing library covering the DSA topics that actually show up in exams and tech interviews
New visualizations every week. Subscribe and learn DSA the visual way.
📸 Gallery


Recent videos
🔀 Audience overlap
EstimatedEstimated shared audience with similar creators — useful for avoiding overlap (or doubling down) when planning a campaign.
 Technoholic Experiment
90%
Technoholic Experiment
90%
 Python Expert
90%
Python Expert
90%
 FACTZAPE
90%
FACTZAPE
90%
 TechSpark
75%
TechSpark
75%
 Uncle Builder
75%
Uncle Builder
75%
 Gogi Tech
73%
Gogi Tech
73%
More like this
Find more →
✉ Message Visualcoders
Reaching out to influencers is a Pro feature. Upgrade to message any influencer directly — perfect for brands and agencies booking sponsorships.
- ✓ Message any influencer from their listing
- ✓ The influencer gets notified by email
- ✓ Manage every conversation in one inbox
Already Pro? Log in.
🎤 Event / appearance with Visualcoders
Booking an event / appearance is a Pro feature. Upgrade to book Visualcoders for an in-person or virtual appearance — payment held safely in escrow until the event is done.
- ✓ Book them for events, livestreams, panels & more
- ✓ Visualcoders gets notified by email
- ✓ Fee held in escrow, released after the appearance
Already Pro? Log in.
You're out of free requests this month
Free accounts get 5 per month. Go Pro for unlimited sponsor pitches, collab requests & sponsorship deals — plus featured placement, the Verified badge, free withdrawals and more.
Upgrade to Pro — $9.95/mo →Your free limit resets on the 1st of next month.