
Unbox Daily ✓
How we estimate
Known for


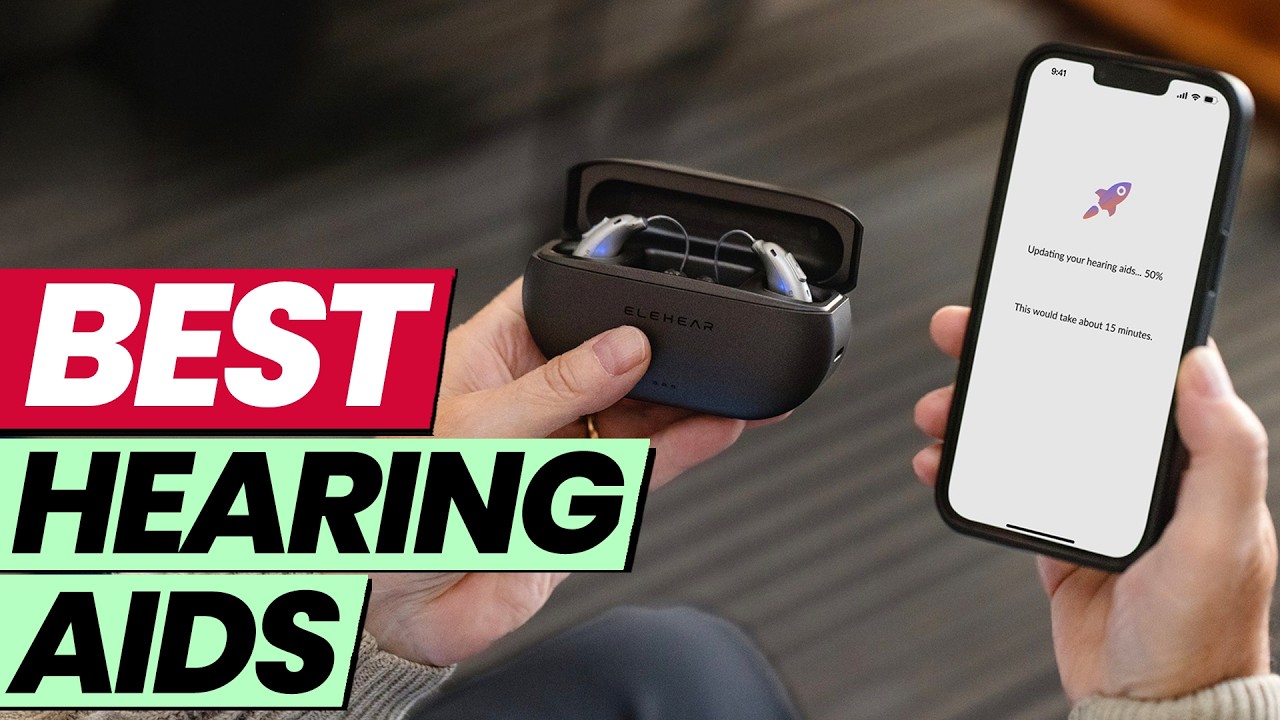
▶️ Featured Video
190 views📈 Performance
💡 Did you know?
🛡️ Audience credibility
- Est. 53% real, active audience · High fake-follower risk.
- Low view-through (~0.8%) — many subscribers don't watch, a sign of an inactive or inflated audience.
- 0.83% engagement — below the ~5% typical for this size.
Heuristic estimate from view-through, engagement vs size and recent growth — a screening signal, not a guarantee.
👥 Audience demographics
EstimatedModeled from this creator's niche, platform & region — a planning estimate, not connected analytics.
- United Kingdom44%
- United States18%
- Ireland5%
- Australia5%
- Canada4%
💚 Brand affinity
EstimatedBrands Unbox Daily's audience is most likely to respond to — from detected sponsorships in this niche.
About
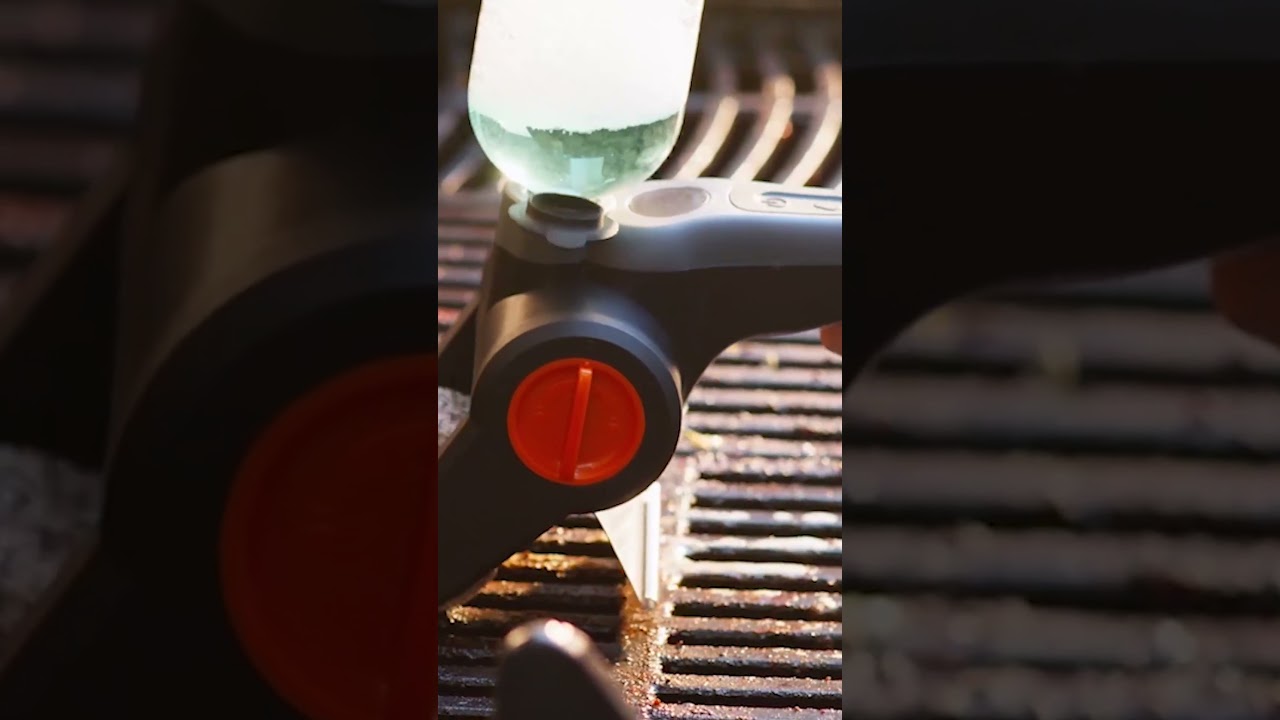
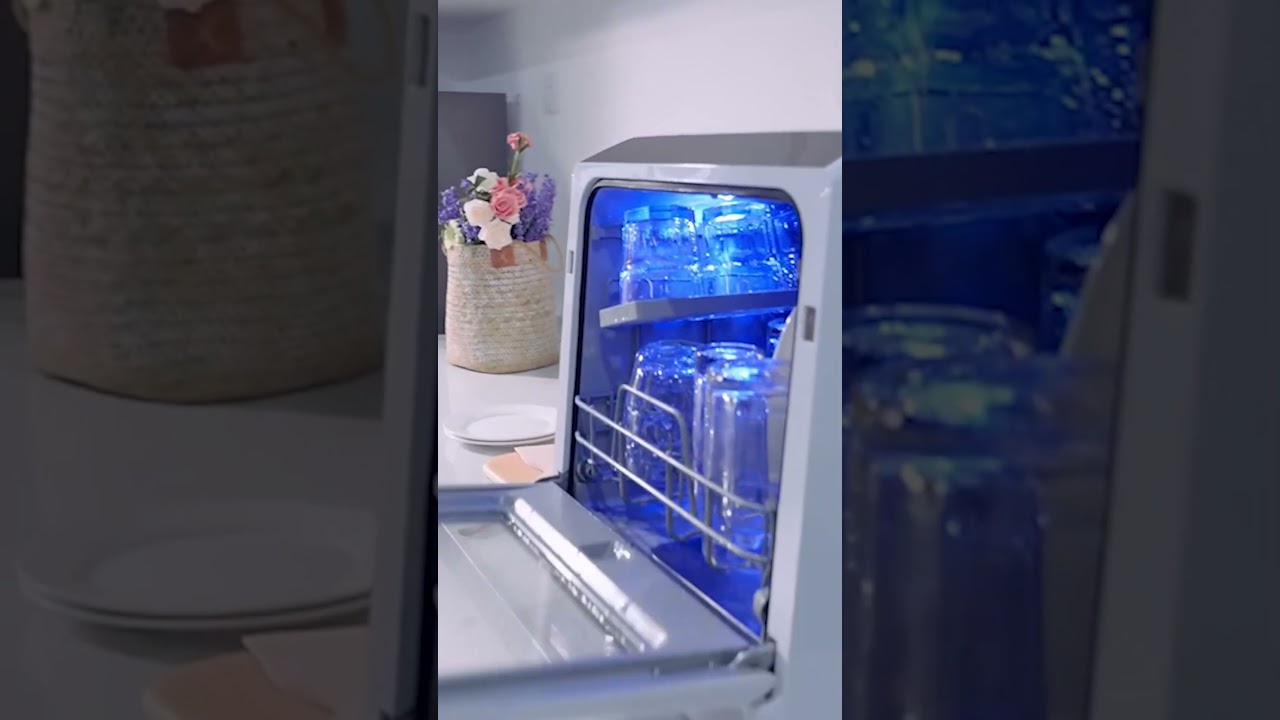
Discover the best Amazon gadgets with our daily tech reviews. We provide in-depth comparisons, honest recommendations, and simple breakdowns of popular consumer electronics. From smart home devices to budget-friendly accessories, our videos help you find the right product fast. Subscribe for trusted gadget reviews, feature comparisons, and up-to-date tech insights every day.
DISCLAIMER:
Portions of footage found in this channel are not original contents produced by me. Pieces of products' stock footages were gathered from multiple sources, including manufacturers, fellow creators, and various other sources. If something belongs to you, and you want it to be excluded, please do not hesitate to contact me at
Subscribe!
📸 Gallery


Recent videos
🔀 Audience overlap
EstimatedEstimated shared audience with similar creators — useful for avoiding overlap (or doubling down) when planning a campaign.
 M0FXB HamTech - World of Hobby Radio Tech Gadgets
59%
M0FXB HamTech - World of Hobby Radio Tech Gadgets
59%
 M5Stack
59%
M5Stack
59%
 Cayle
58%
Cayle
58%
 Ash Does Tech
56%
Ash Does Tech
56%
 Ben Harvey Photography
55%
Ben Harvey Photography
55%
 Zero PC Build - Tech
55%
Zero PC Build - Tech
55%
More like this
Find more →
✉ Message Unbox Daily
Reaching out to influencers is a Pro feature. Upgrade to message any influencer directly — perfect for brands and agencies booking sponsorships.
- ✓ Message any influencer from their listing
- ✓ The influencer gets notified by email
- ✓ Manage every conversation in one inbox
Already Pro? Log in.
🎤 Event / appearance with Unbox Daily
Booking an event / appearance is a Pro feature. Upgrade to book Unbox Daily for an in-person or virtual appearance — payment held safely in escrow until the event is done.
- ✓ Book them for events, livestreams, panels & more
- ✓ Unbox Daily gets notified by email
- ✓ Fee held in escrow, released after the appearance
Already Pro? Log in.
You're out of free requests this month
Free accounts get 5 per month. Go Pro for unlimited sponsor pitches, collab requests & sponsorship deals — plus featured placement, the Verified badge, free withdrawals and more.
Upgrade to Pro — $9.95/mo →Your free limit resets on the 1st of next month.